I build analytics systems, ML models and autonomous AI architectures.
An interactive analytics dashboard for the leadership of the Russian Water Sports Federation: from scattered Excel files to a single data-driven decision system.
Data on athletes, coaches, venues and results was stored across dozens of separate files and systems. Preparing a single analytics report took weeks of manual work. Leadership had no holistic view of the industry.
Leadership got a decision-making tool: where infrastructure is overloaded, where it's underused, which regions are drivers. The ability to model the effect of investments.

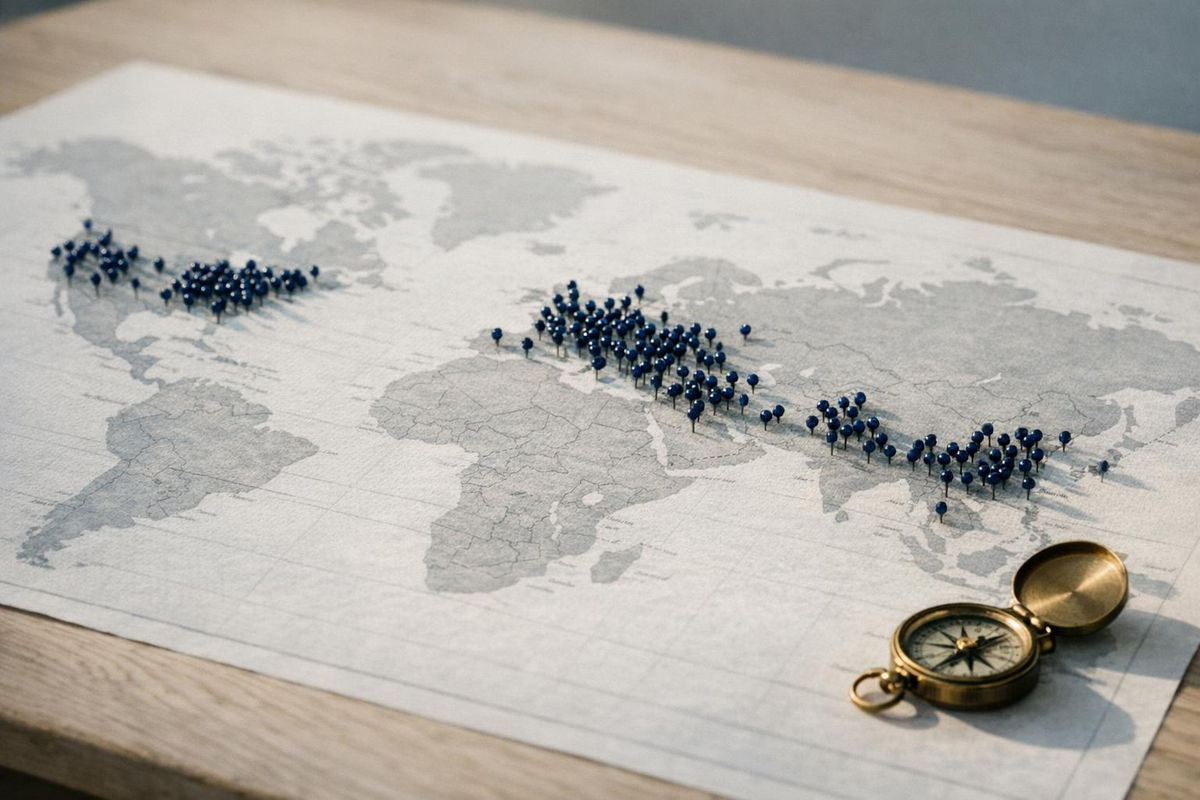
Open the interactive map →From a Russia dashboard to the global picture: an interactive world map that ranks 198 countries by a Swimming-Education Development Index (SDI), built on deep research of official sources.
There was no single, comparable picture of how countries develop mass swimming education and water safety. The data was scattered across national federations, ministries and methodology documents in dozens of languages.
A single tool to compare countries, separate leaders from laggards and ground decisions in transparent, reproducible scoring.
Open the world map →A model that estimates each swimmer's medal chances from their competition history and result dynamics.
The federation funds the training of hundreds of athletes, but the budget is limited. Coaches pick candidates intuitively — subjectively and without common criteria.
The model predicts a medalist with 91.6% accuracy. Five top factors: current level, peer ranking, progress rate, peak progression, consistency. Every prediction comes with an explanation.
A computer-vision system that builds a digital skeleton of an athlete from video, measures joint angles and detects movement asymmetries.
A coach judges technique by eye — but misses micro-asymmetries that reduce efficiency and raise injury risk. Objective numbers are needed: angles, ranges, side balance.
Coaches got objective metrics instead of subjective judgement. Athletes correct movements faster and lower injury risk thanks to early imbalance diagnosis.
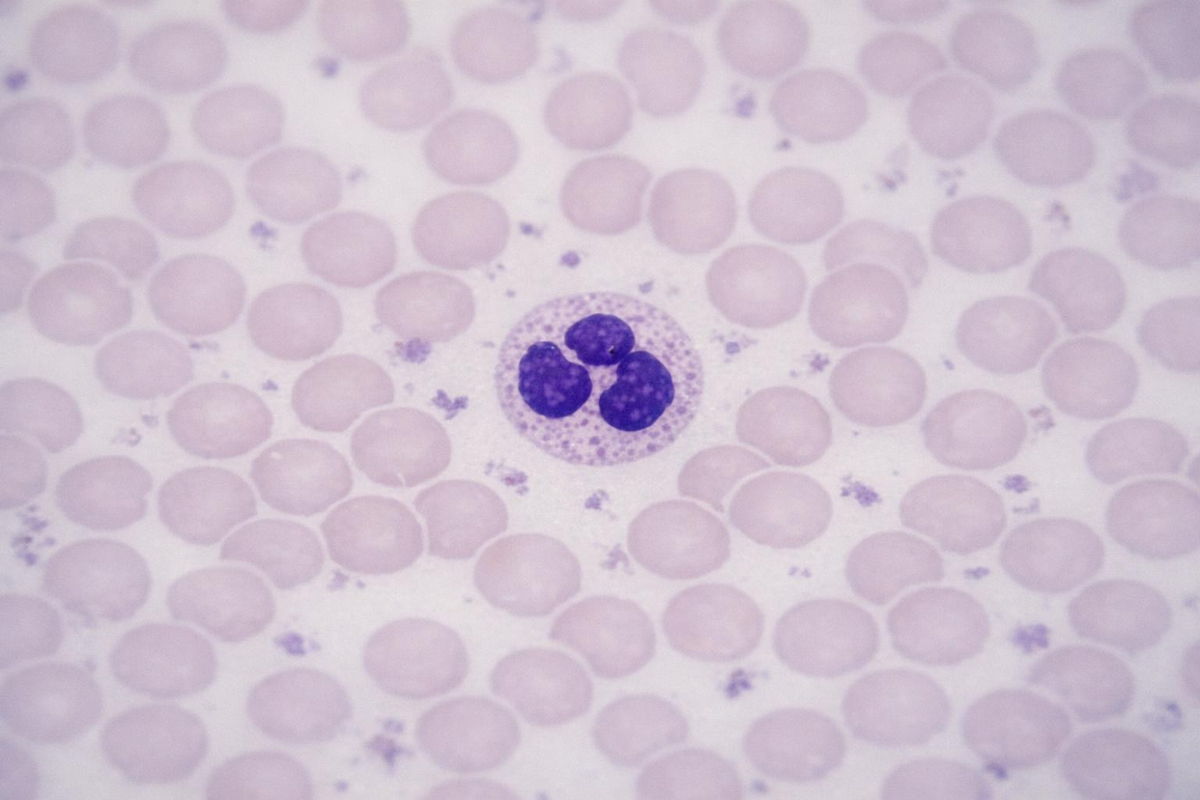
A neural network that finds and classifies red cells, white cells and platelets on blood-smear images — instantly and without a lab technician.
Lab technicians count blood cells by hand under a microscope — slow, tiring and error-prone. One image takes minutes, and there are dozens a day.
The model confidently detects cells at 0.9+ confidence. One image — in a second instead of minutes of manual counting. A ready base for integration into lab systems.
n8n workflows that replace routine: they ingest documents, extract data, draft replies, update databases and dispatch results — with no human in the loop.
Teams spend hours on repetitive tasks: parsing documents, moving data between systems, drafting standard replies. Each is simple, but there are hundreds.
Each scenario is a visual n8n pipeline: a trigger (webhook, schedule, file) starts a chain of steps, AI processes the data, and the result goes to the right system. 24/7, no code.
One "Go!" turns 1000+ source documents (~1.5 GB of scans, contracts and estimates) into a fund-ready, financially-audited DOCX — orchestrated by Claude across deterministic Python and a fleet of parallel sub-agents.
Official grant reports demand a DOCX with a line-by-line financial audit, assembled from gigabytes of messy scans, contracts, payment orders and estimates. By hand it's days of tedious, error-prone work.
~1.5 GB of source materials → an audited, fund-ready report in a single run, every line cross-checked and commented. Days of manual work collapse into minutes.
A clinical app for sports medicine: it parses lab reports into structured markers, tracks trends against a reference-value catalog, and exports PDF/XLSX — behind role-based access and a full audit trail. Special-category medical data never leaves the closed loop.
Athletes' lab results — special-category personal data — were scattered across PDFs from different labs. Doctors needed trends over time in one place, but cloud services are a non-starter for sensitive medical data.
Doctors get longitudinal trends and instant reports; the organization keeps full control — medical data stays inside the perimeter, every access is logged, and nothing goes to the cloud.
A clear map: what to do first, what it yields in money, and whether to start at all — before you've spent a dollar on development.
Your first measurable AI result inside your own systems — in weeks, not half a year. Then you decide on facts: scale, stop, or move to a subscription.
An external AI department for a fraction of the cost of a team: expertise and hands-on work month to month, small steps, and the option to leave anytime.
A dev team means several salaries, taxes, equipment and months to hire. Even one full-time data hire runs ~$8–12K/mo fully loaded — plus the risk there's no work left for them in six months.
An agency books months and a five-figure-plus budget where you pay for account managers and slide decks — even when the real work is a few weeks.
You work with me directly, and automation handles the routine: one person does the work of a small team — no markup, no idle time. Usually 5–10× cheaper, and you can start or stop anytime.
One or two shipped workflows — a knowledge-base assistant, routine automation, a dashboard — pay for a month of the subscription.
Open to collaboration and new projects in data and automation. I reply fast — reach out on any channel.